 FI
FI
 UK
UK
Markkinamuutosten valinta taulukoittain sisältää joukon tehokkaita olennaisia suodattimia, jotka helpottavat ymmärtämään alueiden muuttuvaa dynamiikkaa viikoittain nopeasti. Näitä ovat toisaalta tarjouksen kestoon & hinnoitteluun liittyvät tekijät ja toisaalta kodin & talon perustekijöihin nojaavat tietyt valinnat. Tässä kerrotaan tarkemmin näiden hyödyistä & ominaisuuksista.
Älykkäät suodattimet löytyvät ja ohjaavat kaikkien kolmen taulukon näkymiä yhtä aikaa yhdellä painalluksella.
Kunkin taulukon näkymä siis muuttuu kerralla riippuen siitä suodattimet on valittu päälle jättäen vain näitä koskevat rivit esiin.
Lisäksi, lasketaan automaattisesti ilmoituste KPL -määrät sekä taulukoihin myös prosentteina sama suhteessa kaikkiin niiden omiin ilmoituksiin.
Näin yleiskuvan luominen koko alueen markkinasta on hyvin nopeaa ja tehokasta.
Keston ja hinnoittelun suodatukset
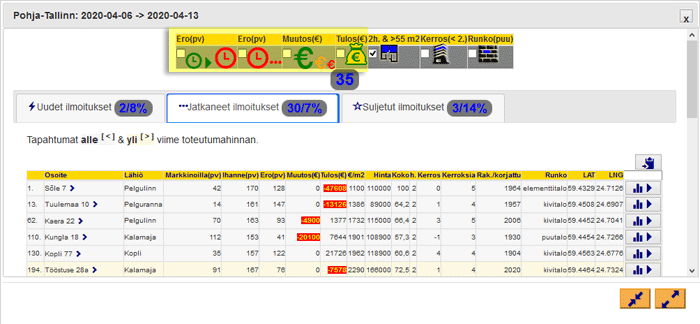
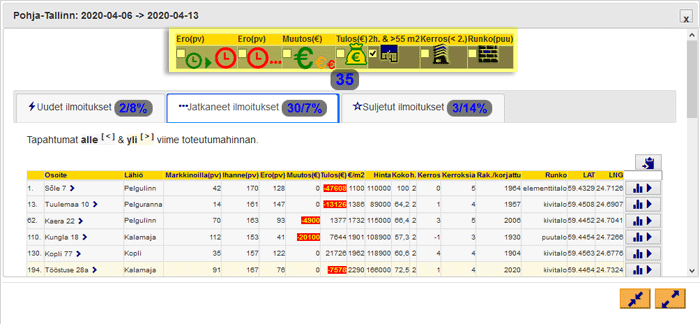
Näissä suodatuksissa keskitytään kolmeen tärkeimpään sarakkaaseen: ihannemyynnin viivästymiseen (Ero), hintapyynnön tippumisiin (Muutos) ja arvioituun nettotulokseen myyjälle (Tulos).
 _Ihanneajan äskettäinen ylitys tapahtuu aina silloin kun ihanneaika painuu negatiiviseksi ihan ensimmäisiä kertojaan. Markkinoilla olon aika kasvaa tällöin suuremmaksi kuin sen arvioitu ihanneaika päivissä kaupunginosassa.
 _Kaikki ihanneaikojen ylitykset valittuna suodattimena kertoo taas siitä miten suuri osa kaikkiaan on ylittänyt omassa taulukon ryhmässään ihanneaikansa.
 _Hintojen tippumisen suodatuksella valitaan vain kaikki ilmoitukset, jotka ovat kokeneet tarkistuksia alaspäin koko myyntikaarensa aikana suhteessa listauksen lähtöhintaan.
 _Kannattavalla nettotuloksella näytetään sellaiset ilmoitukset, joissa arvioitu kannattavuus on korkeampi kuin myyjän asettama pyyntö. Tässä käytetään kotiselaimen standardia arviointia, joka ottaa huomioon sekä talon sijainnin että talon & kodin tunnetut peruspiirteet (ts kerroksen, rakennusvuoden, jne).
Kodin & talon keskeiset markkinapiirteet
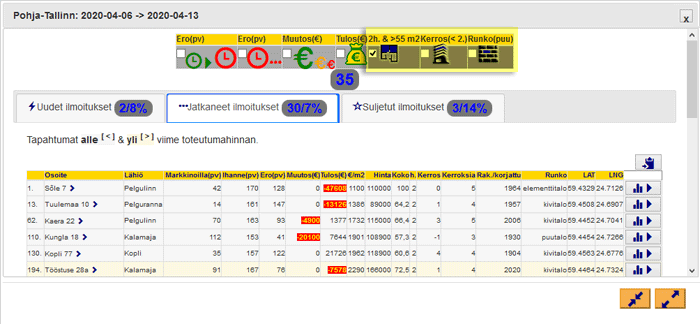
Nämä valinnat kohdistuvat neljään sarakkaaseen sekä kolmeen tärkeään ryhmään kodin piirteitä: kokoon, kerrokseen & talon materiaaliin. Suodattimien juuri näitä esivalintoja selittää pitkältä markkinoilta opittu ja havaittu hintadynamiikka erityisesti niiden kilpailukykyisimpien kannattavien kotien kautta.
 _Suuret kaksiot valintana tuo esiin vain sellaiset kaksiot joiden koko ylittää kaupungin normaalin keskiarvon (ts 55 m2) kooltaan.
 _Pohjakerroksien valinta puolestaan aktivoi vain ne ilmoitukset, joissa koti sijaitsee alle 2. kerroksessa.
 _Puutalot voidaan myös valita erikseen esiin kaikkiin taulukoihin. Näiden oma rooli on ollut hyvin näkyvä mm keskustan alueella kun uusien kivitalojen valtava massa on vyörynyt markkinoille esiin ja hintamuutoksia on näkynyt yhä lisää mm TOP-ALEt listauksissa näille.
Markkinakuvan tulkinta valinnoista
Kun edellä kerrotus valinnat tulevat tutuiksi eli ”automaattiseksi osaksi hermostoa” voit helposti asettaa makrotason kysymyksiä markkinoista yhdistelemällä valintoja luovasti ja vastata niihin heti. Esimerkiksi vaikkapa seuraavasti.
- Miten suuri osa isoista kaksioista on ylittänyt normaalin markkinointinsa tilanteen keskustassa?
- Kuinka moni puutalo on tippunut pyynnöissään ja sisältää ostajalle nettohyödyn keskustan kasvaneen uudistuotannon myötä?
- Miten moni pohjakerroksen myynti on jo laskenut hintojaan Pohja-Tallinnassa nykyään?
- Kuinka moni pyyntö on päätynyt ostajalle kannattavaksi laskemalla ensin hintojaan alueellaan?
- Miten monta pohjakerroksen kotia sijaitsee myymättä juuri puutaloissa?
Ihan lopuksi kannattaa toki muistaa, että asuntomarkkina on dynaaminen ja muutoksia tapahtuu joskus nopeastikin eli kannattaa seurata systemaattisesti jotain aluetta aina pidempään.
Selecting market changes in tables at once includes a set of powerful essential filters that make it easier to quickly understand the changing dynamics of regions on a weekly basis. These include factors related to offer duration & pricing on the one hand, and certain choices based on the basics of the home & house on the other. Here are more details about their benefits & features.
Smart selections automatically
These smart filters control views of all three tables simultaneously with just a single click.
Thus, the view of each table changes at a time, depending on which filters are selected on, leaving only those rows visible.
In addition, the amount of offers are automatically calculated and a percentage of amounts in relation to all sales offers.
In this way, creating an overview of the entire market in the region is very fast and efficient.
Sales duration and pricing filters
These filters focus on three main columns: Ideal Sales Delay (Ero), Price Request Drops (Muutos), and Estimated Net Result to Seller (Tulos).
- _The recent overshoot of the ideal time always occurs when the ideal time becomes negative for the very first time. The time spent on the market then increases beyond its estimated ideal time in days in the district.
- _All exceeded ideal times as the selected filter tells you how many of the all offers has exceeded its ideal time in its own table.
- _Price’s dropping filter selects only all ads that have experienced downward move throughout their sales cycle relative to the starting price.
- _The profitable net result shows listings where the estimated profitability is higher than the current request made by the seller. A standard method of the home browser is used here, which takes into account both the location of the house and the known basic features of the house & home (i.e. home’s floor, house’s year of construction, etc.).
Key market features of home & house
These choices target four columns as well as three important home features: size, floor & house’s material. These pre-selections of filters are here due to learned and observed dynamics of market during longer time. Especially, they come from most competitive profitable homes segment.
- _Large one bedroom homes of which size exceeds the normal average size (ie 55 m2) are selected.
- _The selection of ground floors, in turn, activates only those alerts where the home is located below the 2nd floor.
- _Wooden houses can also be selected individually for all tables. Their own role has been very visible, for example, in the downtown area, as the huge mass of new stone houses has flooded the market and price changes have been reflected more and more in the TOP-ALEt listings for this group.
Understanding your market sentiment
Once the above tools of choices become more familiar, i.e., an “automatic part of thinking” you can easily ask general macro-level questions yourself about the market by combining the choices creatively together. For examples like these questions.
- How many of the big one-bedroom apartments have exceeded their normal marketing time in the center?
- How many wooden houses have dropped in their requests and include a net benefit to the buyer due to increased new houses in the center?
- How many ground floor sales have already lowered their prices in the area of Tallinn today?
- How many requests have ended up being profitable for the buyer by first lowering their prices in their area?
- How many ground floor homes are unsold just in the group of wooden houses?
Finally, it is worth remembering that the market of homes is dynamic and changes sometimes happen quickly. So, it is worthwhile systematically monitor an area for longer period in order to gain & confirm those real insights.