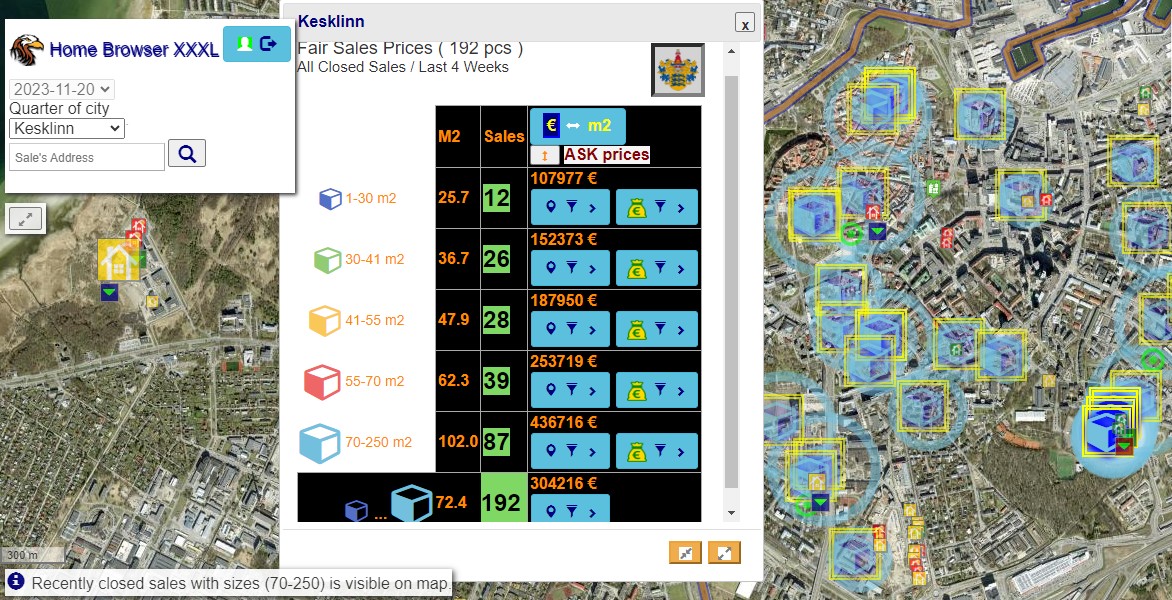
Get a precise picture of what’s been happening in the residential housing market over the past few weeks. With this market tracking tool, you can easily check the dynamics, including all closed sales and either new or old homes in their various price segments. This tabulating tool is a free part of our service and can be conveniently opened for each neighborhood, allowing comparisons with the current situation in the area.
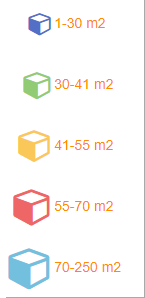
Logical Size Groups for Closed Sales
Understanding the market behavior in each neighborhood is divided into five main groups based on the size of the condos (e.g., 1-30 m2 … 70-250 m2). This presentation of size groups makes it easy and transparent to compare with the situation of actual sales published by the local real estate authority (Maa-amet), using the same classifications.
Average Sizes & Number of Units
The average sizes of homes in each sales group reveal the most desired space in a selected area. A higher number of closed sales in a group also indicates a more accurate representation of what is in demand in the market.
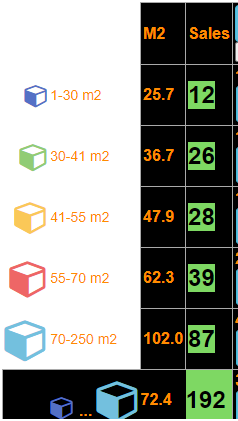
One advantage of our tool is that even with just a few transactions in recent weeks, all closed sales are visible for each house and address. Unlike the real estate authority, which only publicly lists transactions if there are more than 5 transactions happening locally.

For both buyers and sellers, it’s incredibly convenient to instantly see the active price levels in a specific area without restrictions.
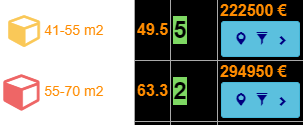
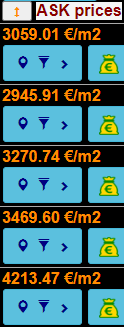
Requests and Fair Prices
The automatically calculated closed asking price (ASK) precisely reflects the average price of homes in the selected sales group in a given area. This price can be used to preliminarily compare other similar-sized sales in the neighborhood.

The Lowest Price Limits
Buyer’s fair prices (BID) are also automatically available with a single click. This full calculation is based on a weighted sample of recently closed homes in the group, adjusted for their distances. Additionally, prices are adjusted based on the normal discount observed in recent real transactions in each neighborhood.
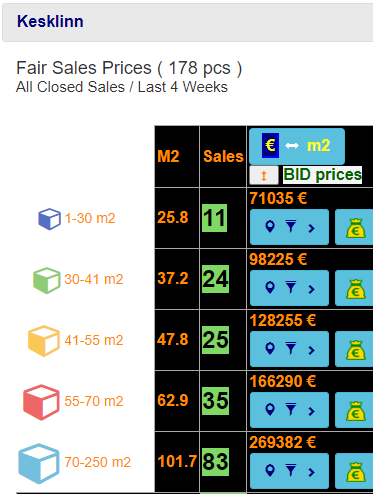
This automatic calculation produces a very good starting point for any investor who wish to look at the local markets more closely & make an open offer to test market’s conditions.
Comparing Apples to Apples
Comparing apples to apples is always better than comparing them to oranges. This can be easily considered in the price table by converting home prices to €/m2. This allows direct comparison with any open sale in the area and its square meter price, understanding how close it is to the neighborhood’s normal asking price or even the lowest fair price in practice.

Precise Comparisons of New Homes
Assessing the price levels of new developments is easy and fast using the automation specifically created for them in the home browser. Information bubbles with their own symbols provide insights into the pricing trends of each new property and its sales. Direct access to a comparison table for each sale allows you to immediately see how reasonable the asking price is in relation to the current market situation.
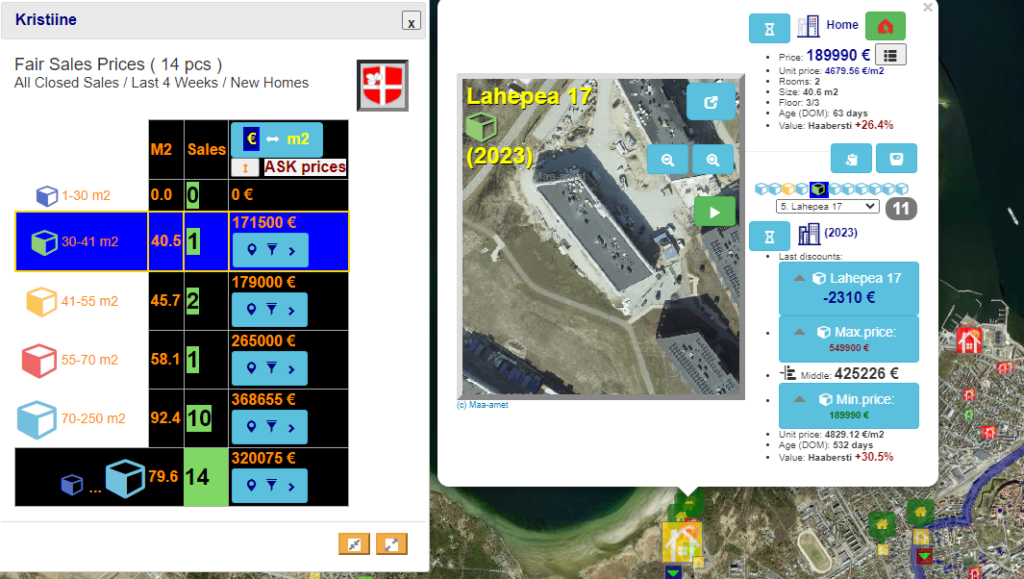
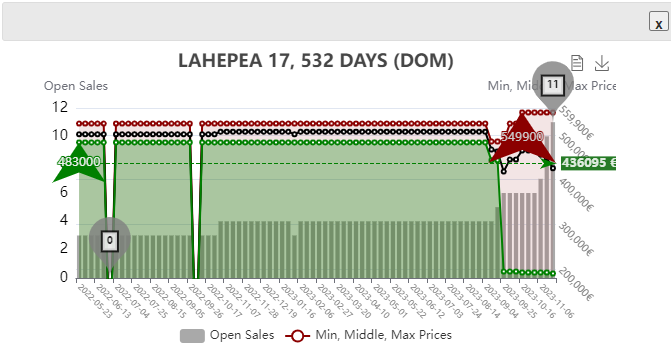
In addition, you can track the entire property’s pricing evolution historically through charts from its opening. This accurately depicts the developer’s sentiments and sales offer decisions as the market progresses from one trend to another.
Visualization and Map Filters

An excellent feature of our tool is the direct presentation of closed sales locations on an interactive map. This makes it quick and easy to read where most sales have occurred recently in the neighborhood.
The KEY BENEFITS
- This helps RE brokers understand and prioritize their time for organizing public property presentations in their own areas most effectively.
- It also informs property investors about the most profitable areas to explore in the current market dynamics.
From each neighborhood’s price table, you can actively filter out only closed sales for a specific size group on the map. For example, if you’re looking to buy a standard two-bedroom condo (41-55 m2 size range), the symbols for this group will appear where the activity has been highest in their closed listings.
NOTE: Visualization on the map is an additional feature activated for registered users of our tool.
Comparisons with Current Profitable Offers
Whether you’re a buyer or seller, you’re interested not only in recently closed sales but also in current offers that provide the best value. For this purpose, the price tables include a button to highlight these active sales.

By comparing the locations of recently closed sales on the map with currently profitable ones, you can quickly determine if there is any interesting active sale nearby.

Each marked symbol (eq golden cash bags above) also immediately shows the profitability level: the larger and more colorful the symbol, the more advantageous the sale is for the buyer.
NOTE: Profitable offers on the map is an additional feature activated for registered users of our tool.